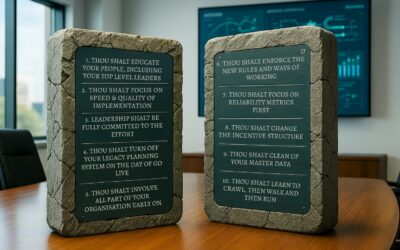
Let’s prove the statement: “The Return on Investment (ROI) of a DDMRP implementation project is determined primarily by the speed and quality of the implementation, much less by its cost.”
We will use a fictitious manufacturing company and simulate two scenarios for its DDMRP implementation in a business line. All cost numbers used below are hypothetical but are in the realistic range of a DDMRP implementation project, depending on size and complexity.
Assume the manufacturing company has the following baseline indicators:
Sales: 100M EUR and 5% year-on-year growth;
Contribution margin: 80% (sales – variable cost only);
Inventories: 20M EUR;
Service level (OTIF): 85% (translating into 4.5M in lost sales revenue);
Expediting expenses: 2M (avoidable logistics expenses necessary to protect service level).
Let us further assume that the inventory carrying cost is 15% and the discount rate for NPV calculation used in the company is 10%.
Scenario A – Investing in Speed and “Right-First-Time” Quality
In scenario A, the company invests appropriately in setting up the implementation, starting with the design of the operating model in Q3 of Year 0. The company will utilise a professional external consultant and ensure DDMRP education (DDP) and change management activities are also done. The total cost in Q3 is EUR 124,000.
During Q4, the team will focus on the implementation, including software setup. They will also participate in additional education and change management activities. The total cost for this quarter is EUR 152,000.
The go-live date is January 1st of Year 1. Consultants will support the company in the post-go-live period for 10 days in Q1 and 5 days in Q2. The total cost between Q1 and Q2 is EUR 30,000.
As of Q3, there are no more consulting costs. The only expense will be the licence for SaaS DDMRP-compliant software (assume EUR 4000 per month).
Outcome of scenario A:
- Inventories: an overall reduction of 25% over the first 3 years (10% Year 1, 10% Year 2, 5% Year 3);
- Service level: rapid increase of service levels from 85% to 95% in Year 1 and then 98% in Year 2;
- Expediting expenses: an 80% reduction during Year 1.
Note that these improvements are quite conservative, and to simplify the case scenario, other savings (e.g., productivity increase in the planning team, increased stability of the production plan, etc.) are omitted.
The total implementation cost is EUR 306,000 for consulting and EUR 150,000 by the end of Year 3 for software licences.
The Net Present Value (NPV) of this project under scenario A is:
EUR 11,078,000 after 3 years
EUR 4,418,000 by the end of year one
EUR 6,380,000 after 2 years

Scenario B – Underinvesting and Cutting Corners to Save Costs
In scenario B, the company cuts corners in change management and the overall consulting cost. The project accumulates delays, and parts of the solution are suboptimally designed and will require redesign after go-live. Hence, the initial results will fall short of expectations, and consultants are dropped to save costs shortly after go-live. The full potential of the project has not been reached.
Outcome of scenario B:
- Due to delays and redesigns, go-live is pushed back by 3 months to April 1st of Year 1.
- Inventories: There were minimal savings in the first half of Year 1, but they eventually reduced by 20% after the buffers were redesigned and parameterised.
- Service level: only increases to 92% in the first year after implementation and then to 95% after two years.
- Expediting expenses: After 1.5 years, they were eventually reduced by 70%.
The total implementation cost for software licences is EUR 168,000 and EUR 150,000 by the end of Year 3.
The Net Present Value (NPV) of this project under scenario B is:
- EUR 1,488,000 by the end of Year 1,
= 66% less compared to scenario A;
- EUR 6,380,000 after 2 years,
= 42% less compared to scenario A;
- EUR 11,078,000 after 3 years,
= 34% less compared to scenario A.

The return is still good, but significantly less than scenario A. Even by eliminating external consulting costs, investing in mandatory DDP courses, and setting up the tool’s technical setup, the NPV is greater under scenario A. Moreover, scenario B projects tend to be delayed by months or even years and sometimes fail altogether.
The final chart below compares cash flow and NPV for scenarios A and B.

Discounted Cash Flow and NPV of scenarios A and B over 3 years


0 Comments